Bioinformatics
I have very extensive experience of both experimental and computational bioinformatics. For the experimental part, I participated in a project that proposed a innovative approach to genome-wide analysis of nascent RNA transcriptome and "stabilome." For the computational part is mathematical modeling and dynamic analysis on the genetic / biochemical network involved in proneural morphogenesis.
Genome-Wide Profiling of RNA Transcript Synthesis and Stability
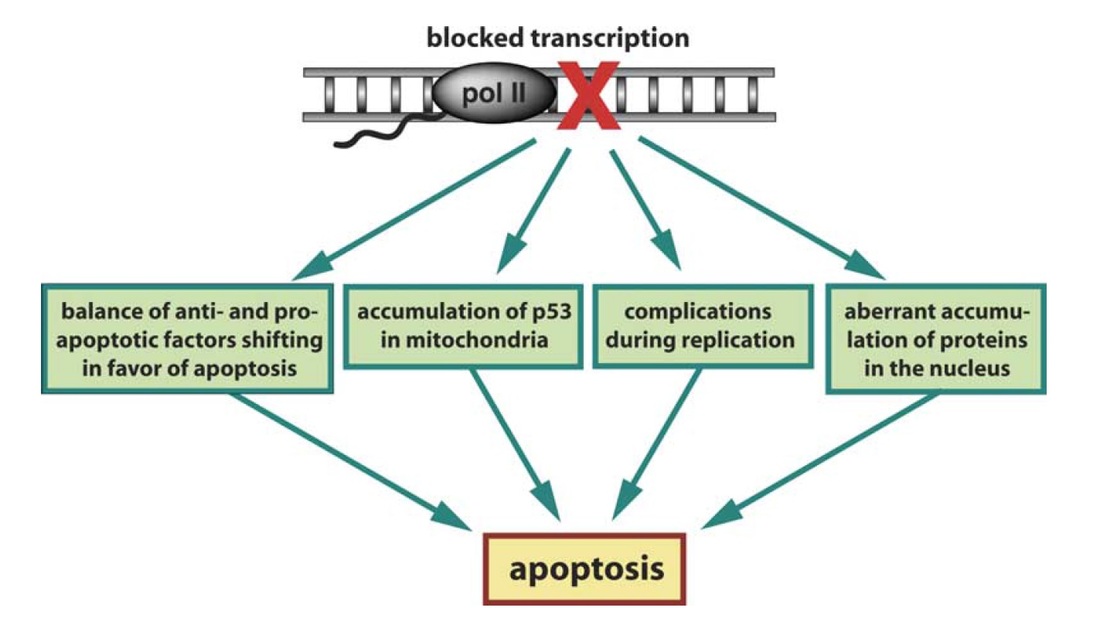 Fig. 1. Possible mechanisms by which blockage of transcription induces apoptosis in cells
One of the motivations for this study is the phenomenon that, following reversible transcription inhibition with the drug DRB, there appears to be a ‘‘point of no return’’ after which reversal of the transcription blockage does not save the cells and eventually apoptosis, or programmed cell death, occurs. While a few mechanisms may be involved in the induction of apoptosis (Fig. 1), the one that draws most attention to us is the balance of anti- and pro-apoptotic factors (Fig. 1, left-most box), which, following transcription inhibition, is solely dictated by the relative stability of the remaining mRNA in those two populations. Based on our analysis, it appears that the half-lives of mRNAs encoding pro-apoptotic components in general are indeed longer than those of mRNAs encoding anti-apoptotic proteins, supporting our hypothesis and emphasizing the influence of mRNA stability on cell phenotype in general. In fact, mRNA stability analysis provides additional information not available in regular transcriptomic microarray analysis, in which only steady-state mRNA levels are probed.
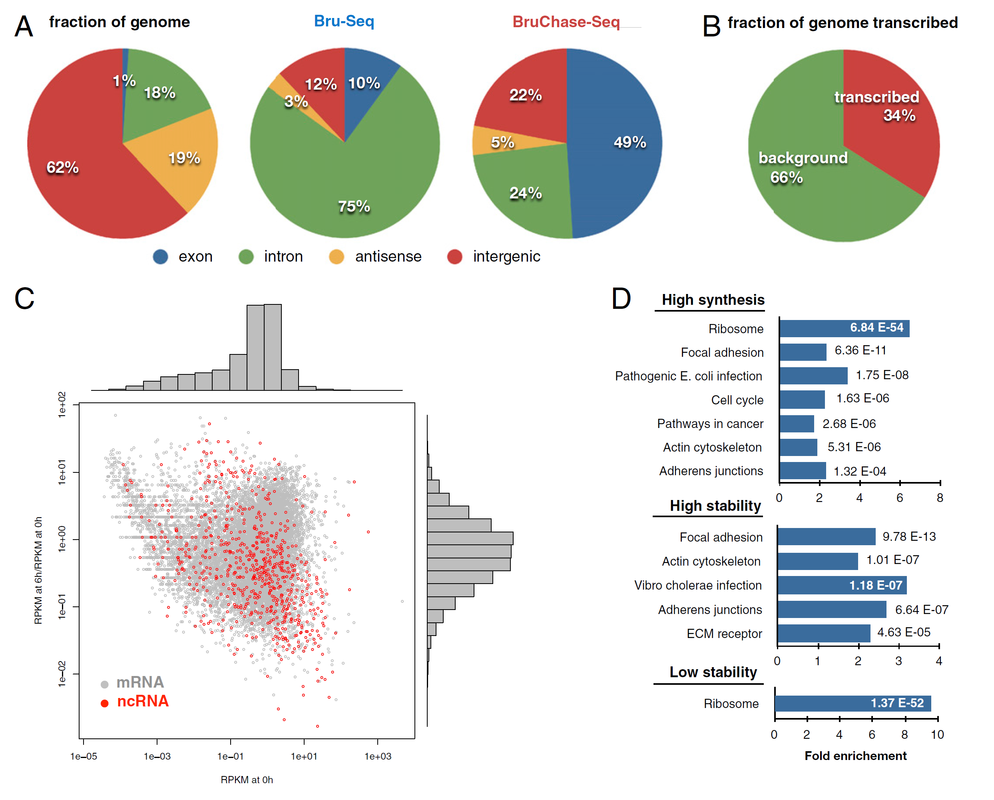 Fig. 2. Genomic distribution of sequencing reads obtained with Bru-Seq (synthesis) and BruChase-Seq (stability)
Aside from mRNA stability, how fast mRNA is synthesized also plays a role - fast synthesis with low stability may imply a high turnover rate of a certain mRNA, which may help cells respond quickly to a certain environmental change, but does not necessarily indicate a high or low steady-state level of that mRNA. On the other hand, following a certain stimulation, such as a drug treatment, it is the immediate synthesis of nascent mRNA that responds to the stimulation the most, not the entire pool of steady-state mRNA that pre-existed in majority before the stimulation.
To account for both the synthesis and stability of RNAs (not just mRNAs), in one of our studies, we used bromouride labeling / sequencing technique (Bru-Seq in Fig. 2) to probe nascent RNA, and bromouridine pulse-chase / sequencing technique (BruChase-Seq in Fig. 2) to probe 6-hour old RNA. While only 1% of the probed sequences were from exons, 10% of the Bru-Seq reads came from exonic regions, while 6-hour old RNA with BruChase-Seq showed that the relative abundance of exonic reads increased to 49% (Fig. 2A). Also, approximately 34% of the genome in fibroblasts (our model cells) was giving rise to a detectable transcription signal (Fig. 2B). When plotting the nascent transcriptome against the RNA "stabilome" of both mRNAs and annotated ncRNAs (noncoding RNAs), we did not observe a clear relationship between relative transcription rate and relative RNA stability (Fig. 2C). Finally, by performing DAVID gene ontology analysis to test for gene enrichment, we were able to find the pathways that involved high synthesis, high stability, or low stability of RNA (Fig. 2D). (Reference: Derheimer, F. A., Chang, C. W., Ljungman, M., Eur. J. Cancer, 2005, 41(16), 2569-2576; Paulsen, M. T., Veloso, A., Prasad, J., Bedi, K., Ljungman, E. A., Tsan, Y. C., Chang, C. W., Tarrier, B., Washburn, J. G., Lyons, R., Robinson, D. R., Kumar-Sinha, C., Wilson, T. E., Ljungman, M., Proceedings of the National Academy of Sciences, 2013, 110(6), 2240-2245)
High-Dimensional Biological System Modeling
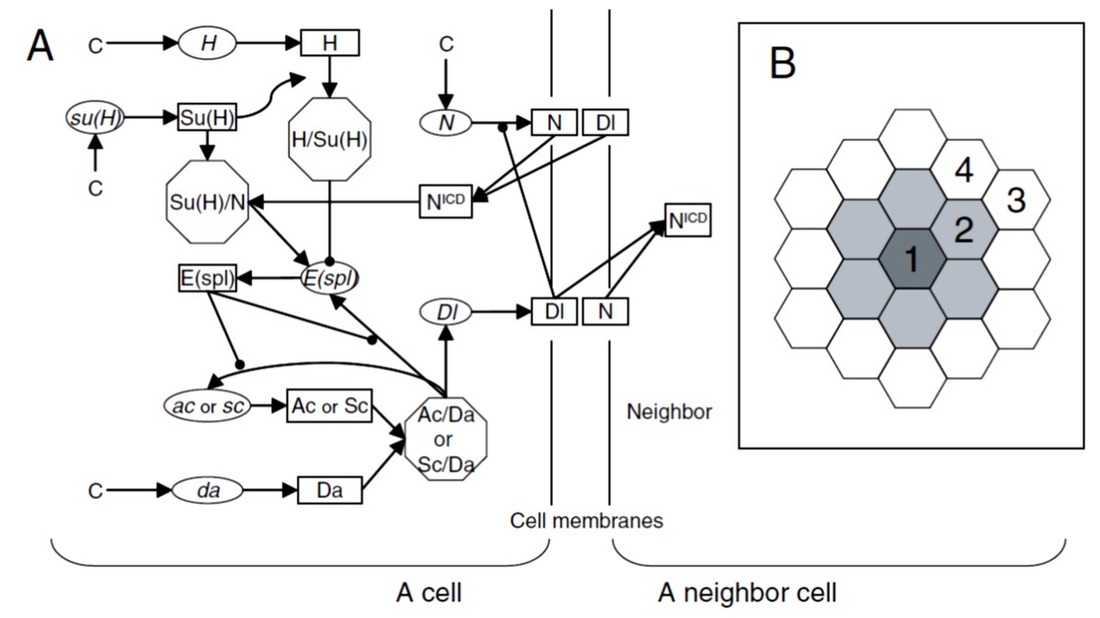 Fig. 3. (A) Network model and (B) cell arrangement for the sensory organ precursor (SOP) simulation.
In this study, we constructed high-dimensional networks of mRNAs and proteins, using genetic and biochemical information, and then investigated the robustness of these networks as well as the dynamics of gene regulation involved. In Fig. 3, the network responsible for Drosophila sensory organ precursor (SOP) formation is shown (Fig. 3A), which is present in every cell in a proneural cluster in the cell arrangement shown in Fig. 3B (shaded cells). Here, the key components are ac and sc (proneural genes), and their protein products AC and SC. If their concentrations are higher than a threshold in a cell, this cell becomes an SOP. The wild-type SOP morphogenesis produces single SOP in the center of a proneural cluster, while some other phenotypes (all SOPs, no SOPs, etc) have also been observed when a certain set of genes are mutated (loss of function or over-expression). These criteria were all used for model parameter selection (see below).
The time evolution of all component concentrations and interactions was simulated using ODEs, and the parameter values (such as kinetic reaction rates and gene activation characteristic constants) were assigned as random numbers in certain ranges - an approach to quantifying the robustness of a network. If a network is robust, then, to some extent it can tolerate genetic and pathway perturbations, which, in our network, can be reflected by variations in the randomly assigned parameter values. In other words, a more robust network can meet the wild-type and mutant criteria more easily with larger ranges of parameter values. In our random search of parameter sets, it will then have a higher "hit rate," which is basically the probability a tested set of parameters meets the criteria. One of our projects was then to determine what network structure was most robust simply by using this hit rate technique, and the conclusion was that with more genes and proteins involved in redundant pathways or feedback loops, the network usually became more robust.
The time evolution of all component concentrations and interactions was simulated using ODEs, and the parameter values (such as kinetic reaction rates and gene activation characteristic constants) were assigned as random numbers in certain ranges - an approach to quantifying the robustness of a network. If a network is robust, then, to some extent it can tolerate genetic and pathway perturbations, which, in our network, can be reflected by variations in the randomly assigned parameter values. In other words, a more robust network can meet the wild-type and mutant criteria more easily with larger ranges of parameter values. In our random search of parameter sets, it will then have a higher "hit rate," which is basically the probability a tested set of parameters meets the criteria. One of our projects was then to determine what network structure was most robust simply by using this hit rate technique, and the conclusion was that with more genes and proteins involved in redundant pathways or feedback loops, the network usually became more robust.
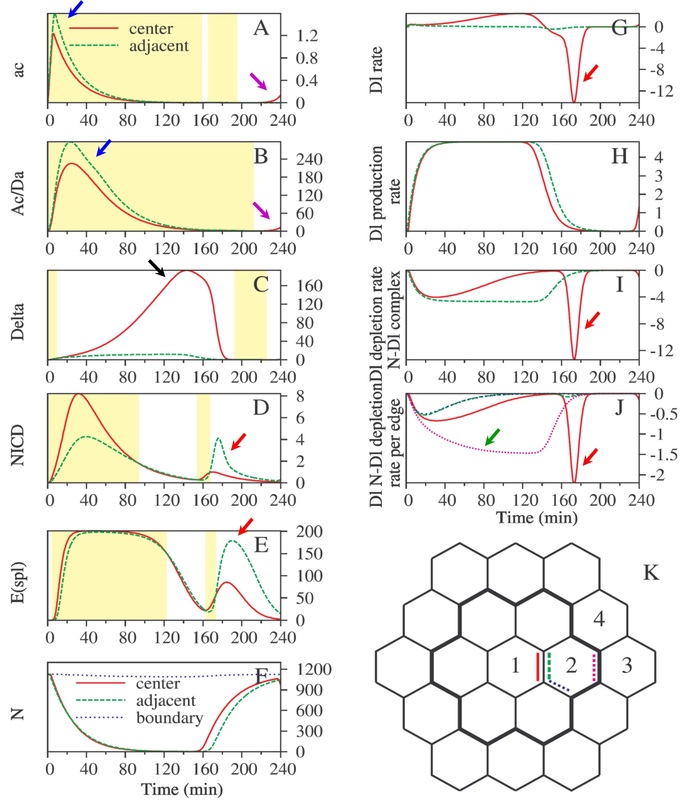 Fig. 4. Time-evolution that elucidates the mechanism of adjacent cell neural fate suppression
One of the parameter sets that met all criteria further elucidated the mechanism the network in Fig. 3A utilizes to prevent adjacent cells (such as cell 2 in Fig. 3B) from becoming SOPs. In Fig. 4, the concentrations of ac (mRNA) and Ac (protein) were set to be 10 times higher (Fig. 4A-B) in the adjacent cells (cell 2 in Fig. 4K) than in the center cell (cell 1 in Fig. 4K). At early stage of time evolution, the concentrations of ac and Ac remained higher in the adjacent cells (blue arrows) than in the center cell. However, this did not make the rate of the protein "Dl" any higher in the adjacent cells (green dashed line in Fig. 4G; also refer to the network shown in Fig. 3A) due to the consumption of Dl into more peripheral cells (from cell 2 to cell 3 through the purple dashed edge in Fig. 4K; green arrow in Fig. 4J). As a result of lack of lateral inhibition from Dl of the adjecent cells, there was an increase of Dl in the center cell (black arrow, Fig. 4C), which flushed into the adjacent cells at 170 min (red arrows in Fig. 4G, 4I-J), causing NICD and E(spl) in adjacent cells to increase (red arrows in Fig. 4D-E) and suppressing ac and Ac in these cells. At the end of the time course, ac and Ac in the center cell would then outnumber those in the adjacent cells, making the center cell the only SOP. (Reference: Chang, C. W., Pi, H., Chien, C. T., Hsu, C.P., J. Genet. Mol. Biol., 2003, 14(4), 243-251; Hsu, C. P., Lee, P. H., Chang, C. W., Lee, C. T., Bioinformatics, 2006, 22, 1375-1382)
