Forster (or Fluorescence) Resonance Energy Transfer (FRET)
I use FRET in both my Ph.D. and postdoc studies, but different approaches are used for FRET detection. FRET can be detected by fluorescence lifetime or intensity. Lifetime-based FRET detection is covered in the FLIM section and here I will focus more on intensity-based detection.
FRET Basics and an Application to Cancer Biology
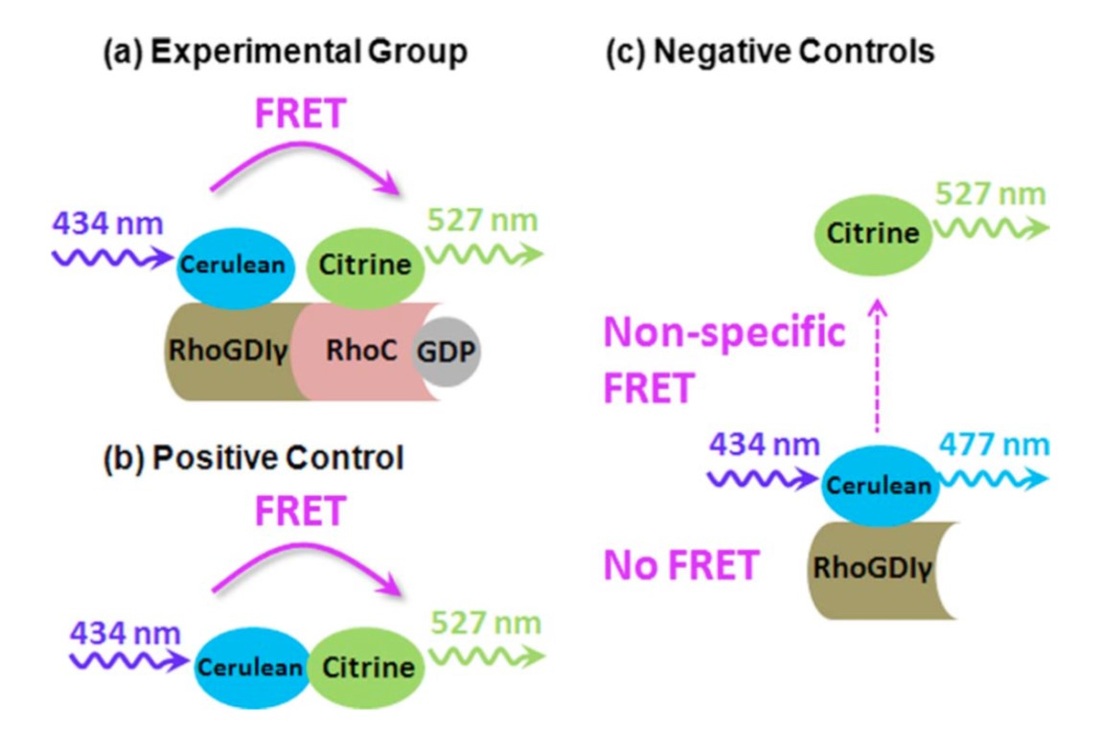 Fig. 1. FRET detection of RhoC inhibition
FRET is a non-radiative energy transfer process (meaning that there is no photon emission during the process) that involve at least one donor and at least one acceptor when they are in close proximity (usually on the scale of a few nanometers). The donor and acceptor do not need to be fluorophores, but if using fluorescent proteins as the donor / acceptor pair, they can be encoded in DNA and transferred to living organisms. Therefore, FRET is often used as an in vivo nanoscale rule by cell and molecular biologists.
In the application of FRET shown in Fig. 1, Cerulean (donor) and Citrine (acceptor) are a FRET pair attached to RhoC and RhoGDIgamma (a) along with a positive control (b) and native controls (c). RhoC is a biomarker for breast cancer and RhoGDIgamma is an inhibitor of RhoC. In this study, we are interested in the detection of live-cell RhoC / RhoGDIgamma interactions using FLIM approach, and see if FLIM works better than intensity-based approach. The results can be found in Fig. 3 in the FLIM section. More details on FRET can also be found in my 2007 book chapter. (Reference: Chang, C.W., D. Sud, and M.A. Mycek, Methods Cell Biol, 2007. 81: p. 495-524; Chang, C. W., Wu, M., Merajver, S. D., and Mycek, M. A., Journal of Biomedical Optics, 2009, 14(6), 060502)
In the application of FRET shown in Fig. 1, Cerulean (donor) and Citrine (acceptor) are a FRET pair attached to RhoC and RhoGDIgamma (a) along with a positive control (b) and native controls (c). RhoC is a biomarker for breast cancer and RhoGDIgamma is an inhibitor of RhoC. In this study, we are interested in the detection of live-cell RhoC / RhoGDIgamma interactions using FLIM approach, and see if FLIM works better than intensity-based approach. The results can be found in Fig. 3 in the FLIM section. More details on FRET can also be found in my 2007 book chapter. (Reference: Chang, C.W., D. Sud, and M.A. Mycek, Methods Cell Biol, 2007. 81: p. 495-524; Chang, C. W., Wu, M., Merajver, S. D., and Mycek, M. A., Journal of Biomedical Optics, 2009, 14(6), 060502)
FRET Application to Cell Mechanics
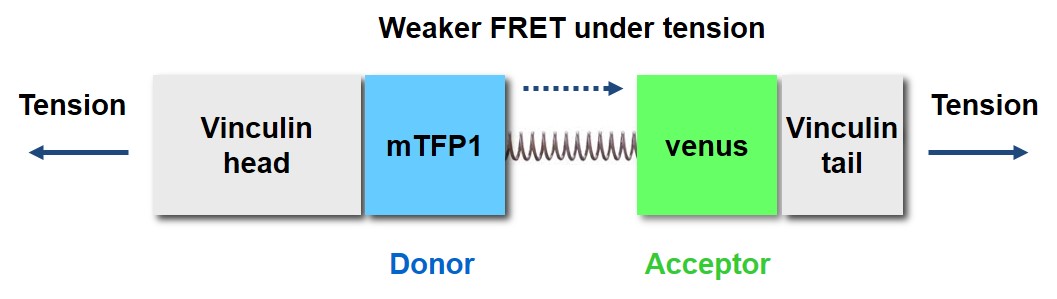 Fig. 2. FRET-based vinculin tension sensor
Vinculin is a mechanosensitive protein that can be recruited in focal adhesions (FAs), which are sub-cellular protein complexes that serve at the linkage between cytoskeleton and extracellular matrix. In the vinculin tension sensor (VinTS; Grashoff 2010) shown in Fig. 2, FRET between the donor fluorophore (mTFP1) and the acceptor fluorophore (venus) is distance-dependent and therefore reflects the tensile strain across the elastic linker and hence the vinculin head and tail domains.
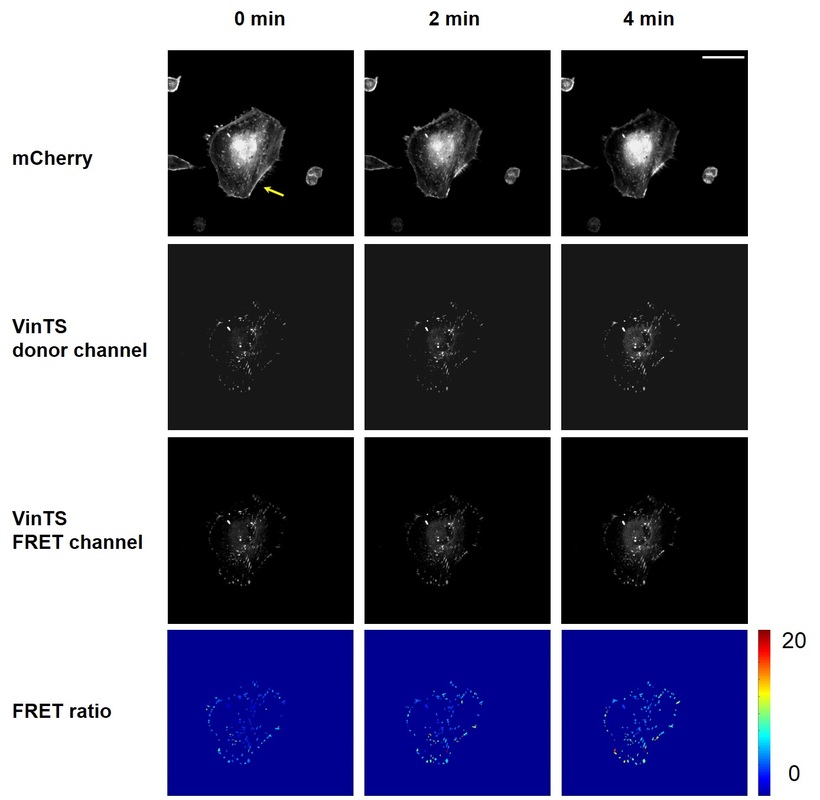 Fig. 3. FRET signal of vinculin tension sensor following stress fiber laser nanosurgery
In one of my studies, VinTS was transiently tranfected into human glioblastoma cells and then laser nanosurgery was applied to stress fibers (see the Cell Mechanics section for more details), such that tension change in FAs can be monitored after tension in stress fibers is released.
In this study, I used intensity-based FRET detection - when the donor is excited, some energy can be transferred to the acceptor and cause the acceptor emission to increase. When the donor and acceptor are on the same molecule, which is the case for VinTS (Fig. 2), it is usually acceptable to simply take the ratio of the FRET channel signal (donor excitation and acceptor emission) to the donor channel signal to indicate how much FRET is occurring.
Fig. 3 shows the results of this study. Stress fiber nanosurgery (yellow arrow at 0 min) and the stress fiber retraction that followed can be seen in the top row. The "FRET ratio" (the bottom row), which is the ratio of the VinTS donor channel signal (the 2nd row) and FRET channel signal (the 3rd rows), indicated vinculin tension in FAs. Note that in the FRET ratio images, all other vinculin signal than the FAs depicted was masked out to facilitate analysis, and this mask was generated by FA segmentation, which can be found in more details in the Image Analysis Section. It can be clearly observed that the tension change occured in FAs throughout the entire cell. For more detailed interpretation of the data, see the Cell Mechanics section. (Reference: Grashoff, C., et al. 2010. Nature. 466: 263-266; Chang, C. W., Kumar, S., Journal of Cell Science, 2013, 126(14), 3021-3030)
