Fluorescence Lifetime Imaging Microscopy (FLIM)
In this section, you can learn the basics of fluorescence lifetime, the instrumentation of FLIM, and an application of FLIM: FLIM-based FRET detection.
Fluorescence Lifetime
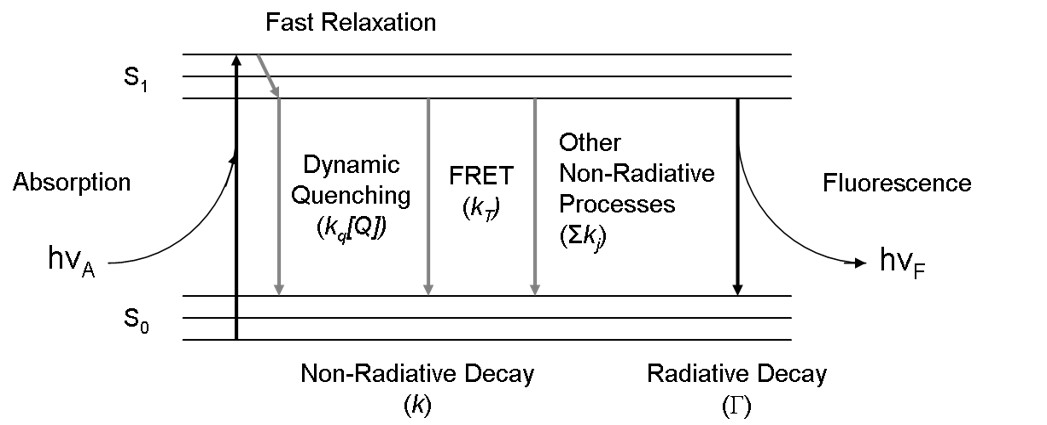 Fig. 1. Simplified Jablonski diagram
Fig. 1 is a simplified Jablonski diagram showing fluorofores (fluorescent molecules) can absorb photons and transition to the 1st excited state (S1). Fluorescence lifetime is then defined as the average time fluorophores
spend in the first excited state following excitation. Fluorescence lifetime is sensitive to (and therefore suitable for the detection of) the physical environment of fluorophores, such as molecular interaction, pH, temperature, but it is independent of factors affecting steady-state intensity measurements, such as fluorophore concentration, photobleaching, excitation intensity variation, meaning that these artifacts will not introduce unwanted variations in lifetime detection. (Reference: Chang,
C.W., D. Sud, and
M.A. Mycek, Methods Cell Biol,
2007. 81: p.
495-524)
Fluorescence Lifetime Determination and FLIM Instrumentation
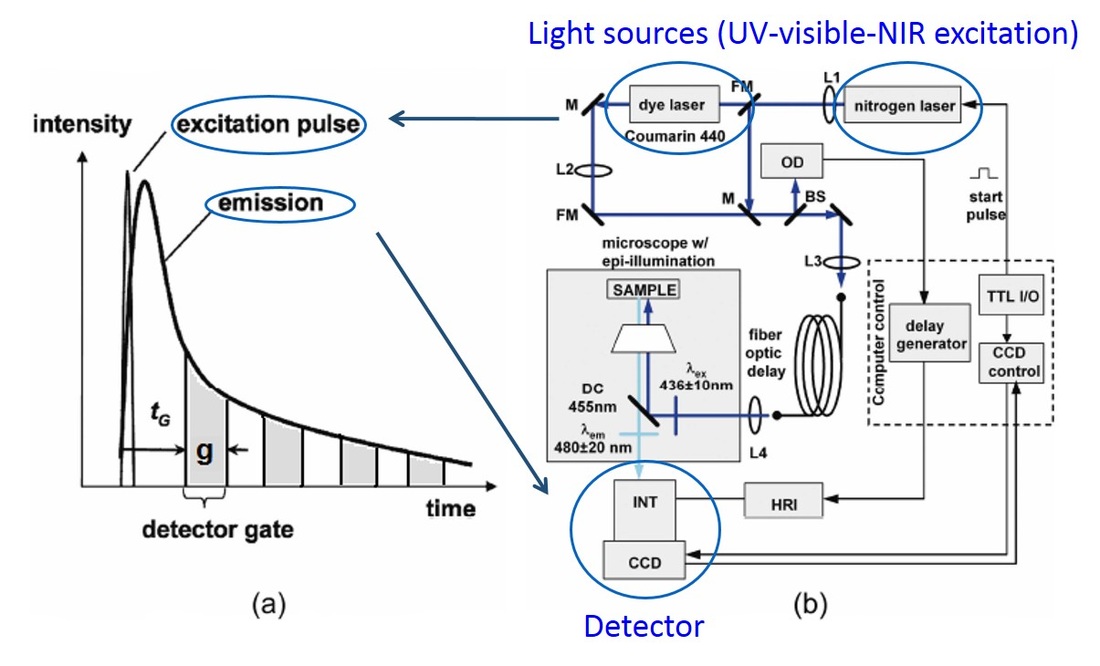 Fig. 2. Time-gated Fluorescence Lifetime Imaging Microscopy (FLIM) system
FLIM is a microscopy system that performs imaging with fluorescence lifetime as the image contrast. Fig. 2 shows the basics of a "time-gated" FLIM (a) and the instrumentation (b) that I used to use at the University of Michigan, Ann Arbor. The basic idea of FLIM is that following pulsed excitation (from a light source such as a femto-second pulsed laser), the sample emission intensity decays exponentially (a). Time-gated FLIM captures this decay curve by detecting the signals in a few gates [gray areas in (a)] and use the signals to fit the curve and calculate the decay characteristic time constant as the fluorescence lifetime. Please note that this is just one way to achieve FLIM in Time Domain. There are other ways to do FLIM in Time Domain as well as in Frequency domain. Please check my 2007 book chapter on FLIM for more details. (Reference: Chang, C.W., D. Sud, and M.A. Mycek, Methods Cell Biol, 2007. 81: p. 495-524; Zhong, W., M. Wu, C. W. Chang et al., Optics Express, 2007. 15(26): p. 18220-18235)
FLIM Detection of FRET
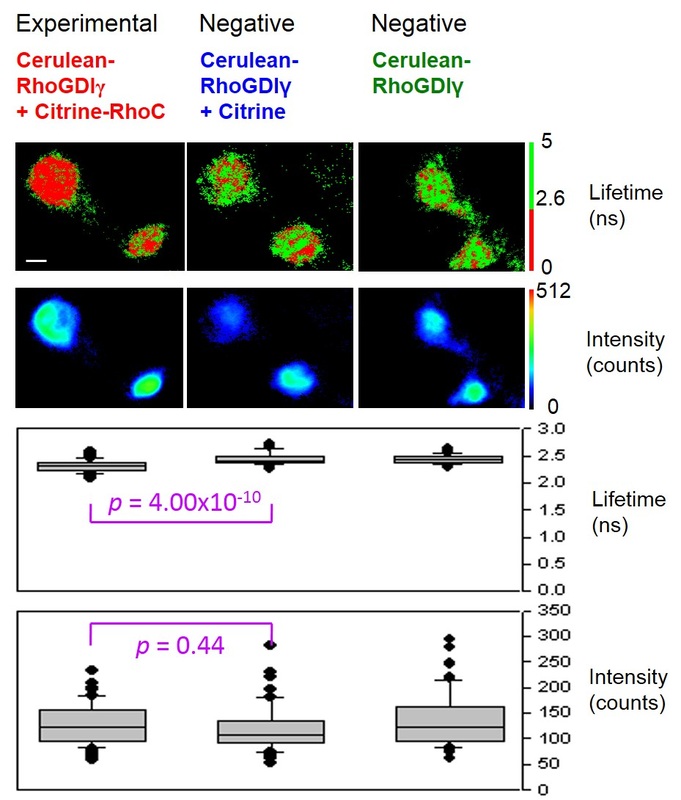 Fig. 3. FLIM detection of FRET for cancer biology
Fig. 3 demonstrates the results of FLIM detection of FRET for the interaction of RhoC (a breast cancer biomarker) and RhoGDIgamma (inhibitor of RhoC) in live cells. For the basics of FRET, take a look at the FRET section. If FRET occurs, it indicates that there is interaction between RhoC and RhoGDIgamma, and the lifetime of the FRET donor (top row in Fig. 3) will decrease due to energy transfer from donor to acceptor.
From the binary color (green and red) presentation of the lifetime images, it can be clearly seen that the experimental group (left column) has redder (lower) lifetime values compared to either of the negative control groups (middle and right columns). This lifetime difference is statistically significant with a small p-value (3rd row). However, due to high inter- and intra-cellular fluorescence intensity variations (2nd row), the intensity-based measurements cannot show such difference statistically (bottom row), which would also be predicted in FRET theory. (Reference: Chang, C. W., Wu, M., Merajver, S. D., and Mycek, M. A., Journal of Biomedical Optics, 2009, 14(6), 060502)
From the binary color (green and red) presentation of the lifetime images, it can be clearly seen that the experimental group (left column) has redder (lower) lifetime values compared to either of the negative control groups (middle and right columns). This lifetime difference is statistically significant with a small p-value (3rd row). However, due to high inter- and intra-cellular fluorescence intensity variations (2nd row), the intensity-based measurements cannot show such difference statistically (bottom row), which would also be predicted in FRET theory. (Reference: Chang, C. W., Wu, M., Merajver, S. D., and Mycek, M. A., Journal of Biomedical Optics, 2009, 14(6), 060502)
